Dashboard
A real-time view of your QA call activity — track uploads, evaluations, scores, and agent performance at a glance.
Elite plan required — Upgrade needed to unlock QA Calls features!
Created April 1, 2026
Overview
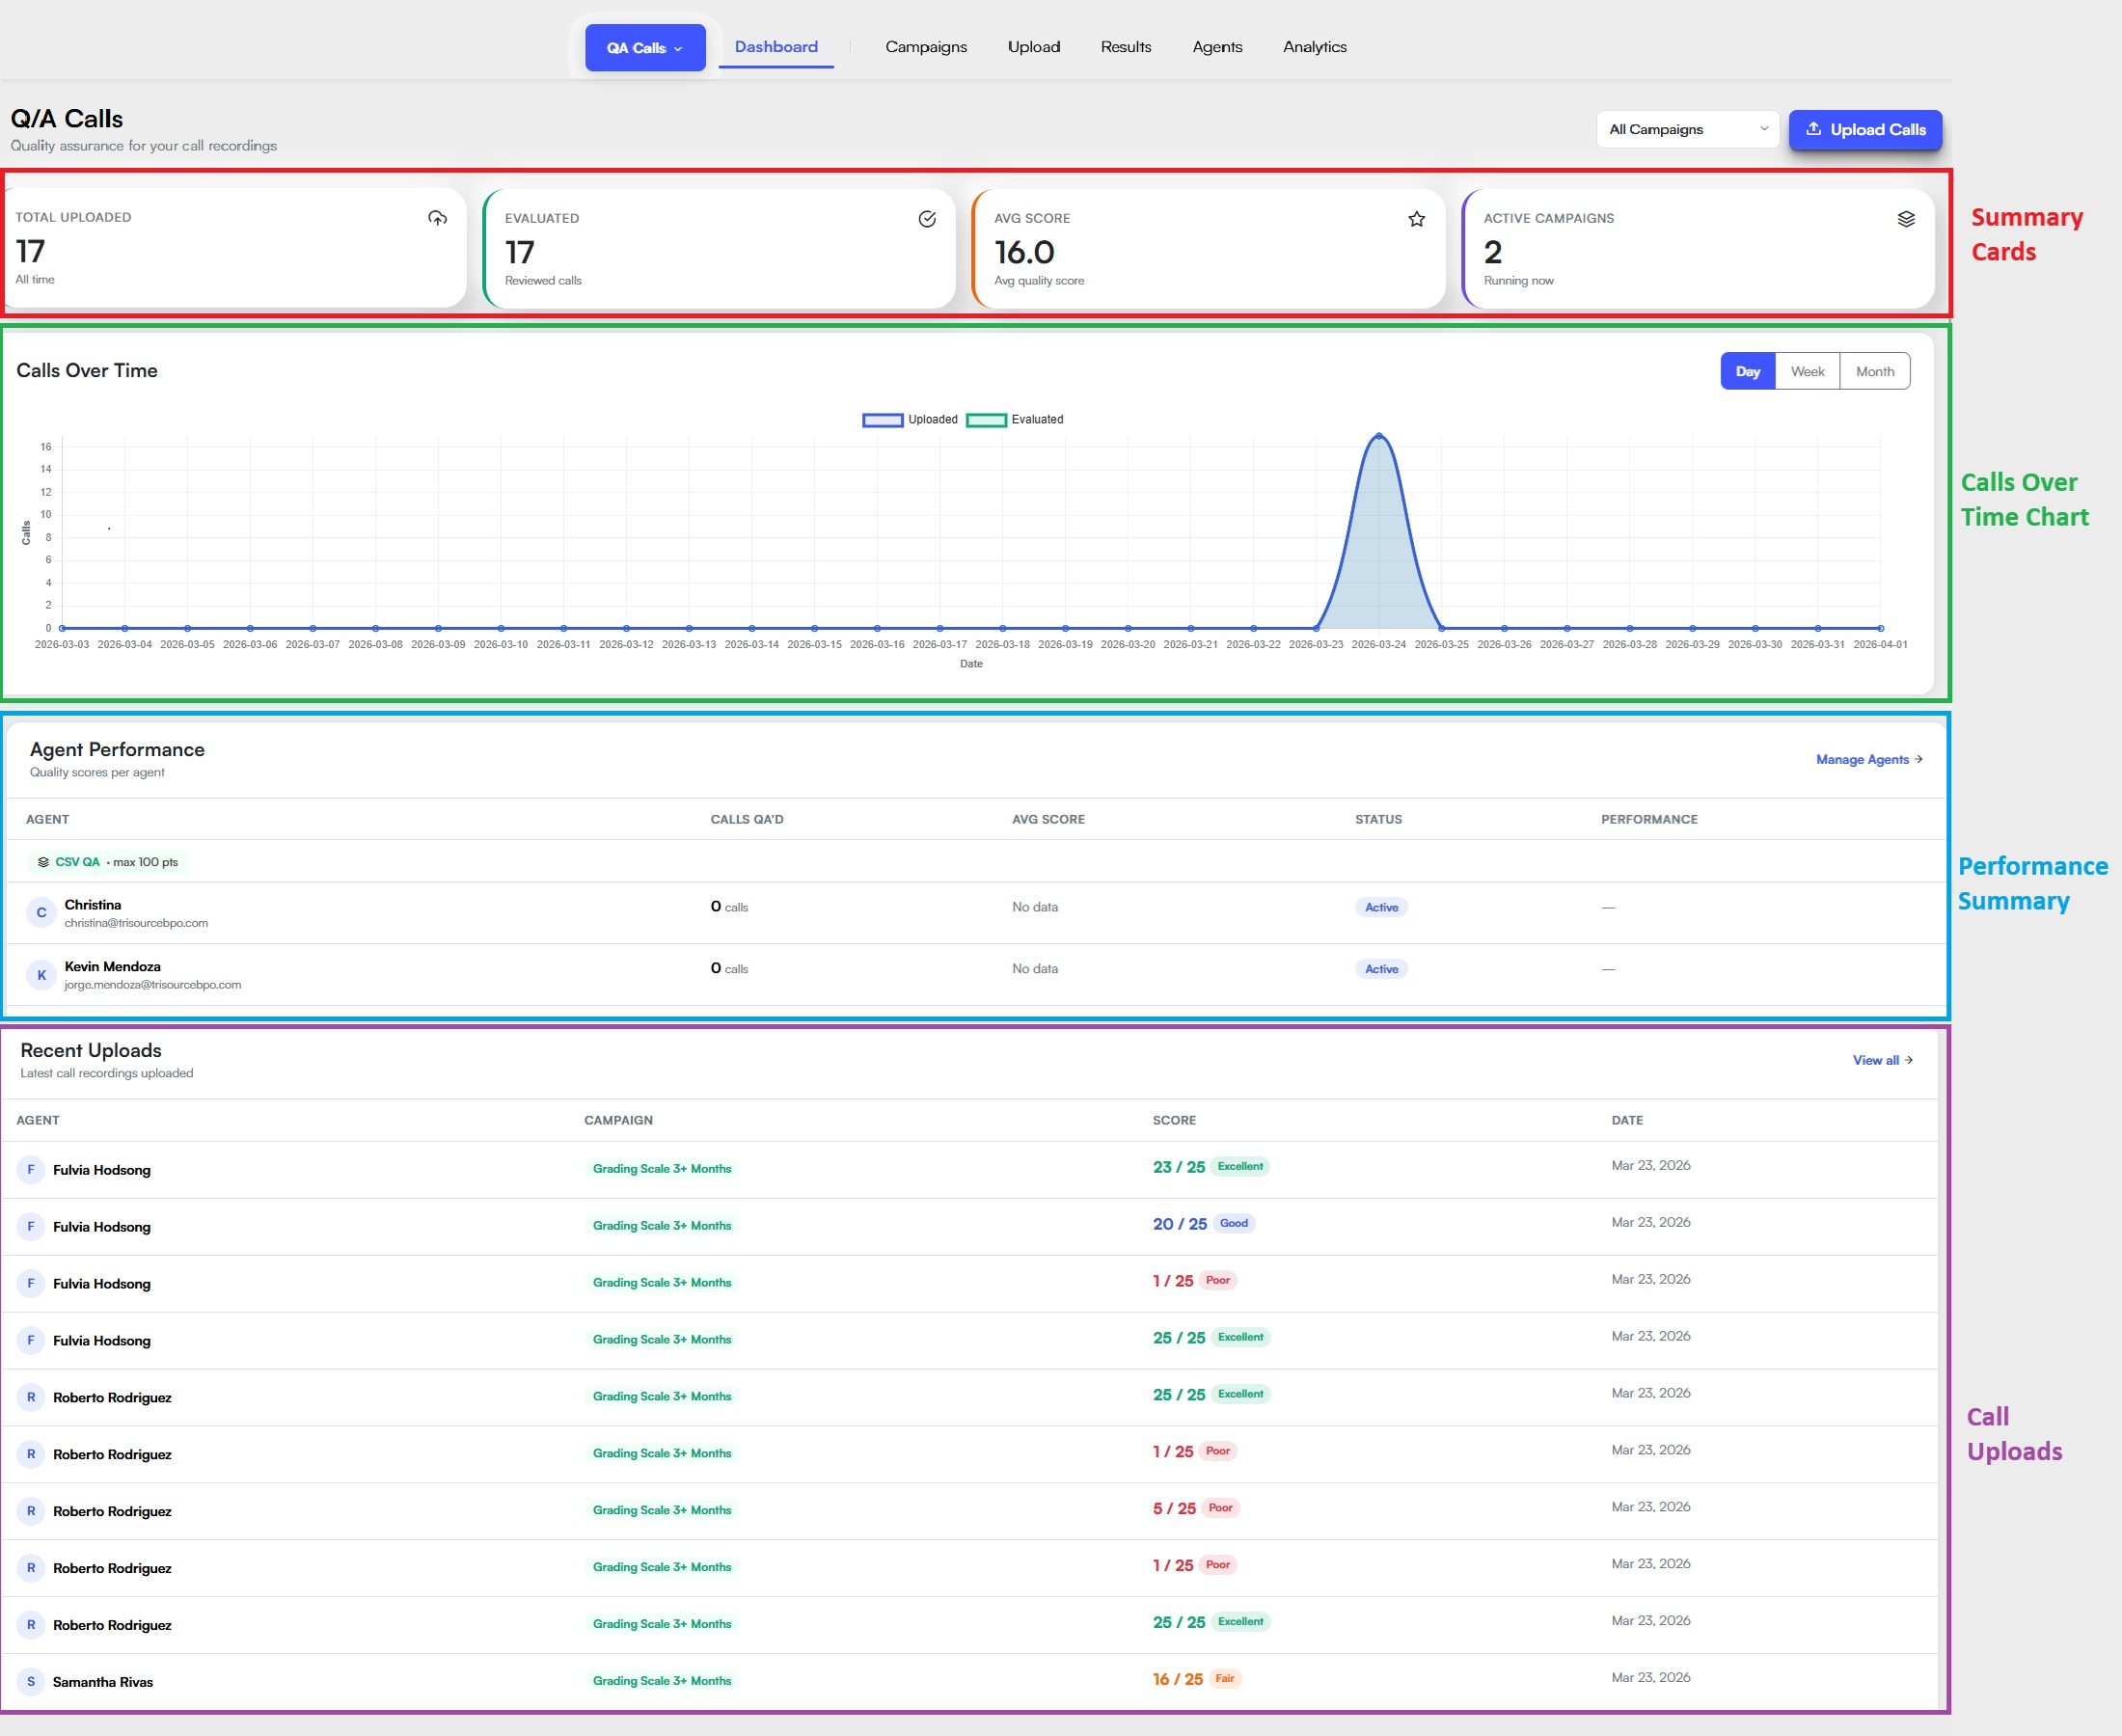
The QA Dashboard gives your team an at-a-glance view of call quality across your organization. It is organized into four sections — summary cards at the top, a calls-over-time chart, an agent performance table, and a recent uploads feed at the bottom.
You can use the dropdown next to Upload Calls to switch between campaigns.
Recent Uploads
A feed of the most recently uploaded call recordings. Click View all → to go to the full uploads list.
- Agent — the agent whose call was uploaded
- Campaign — the QA campaign the call was evaluated under
- Score — the call's score out of the campaign maximum, with a quality label — Excellent, Good, Fair, or Poor
- Date — when the call was uploaded
Summary Cards
Four metric tiles at the top of the dashboard give you an instant snapshot of overall QA activity.
 Total Uploaded
Total number of call recordings uploaded, across all time.
 Evaluated
Total number of calls that have been reviewed and scored.
 Avg Score
The average quality score across all evaluated calls.
 Active Campaigns
Number of QA campaigns currently running.
Calls Over Time
A line chart showing the volume of uploaded and evaluated calls over time. Use the Day, Week, and Month toggles to adjust the time resolution.
- Uploaded — total calls added to the system in the selected period
- Evaluated — calls that were scored within the selected period
Performance Summary
The Agent Performance table breaks down QA activity by agent. Click Manage Agents → to go directly to the Agents page.
- Agent — the agent's name and email address
- Calls QA'd — number of calls evaluated for that agent
- Avg Score — the agent's average quality score across evaluated calls
- Status — whether the agent is currently Active or Inactive
- Performance — a visual indicator of the agent's overall performance trend